It is crucial that all maintenance activities are diagnosed and detailed, with a focus on the quality and reliability of the processes involved. This highlights the importance of having a dedicated computerized maintenance management system (CMMS) to automate all or most of the management tasks. Considering the speed at which information is exchanged and demanded in current management models, maintenance metrics and KPIs (Key Performance Indicators) are essential for decision-making and real-time control of planned or unplanned actions.
With Neovero, it is possible to quickly access metrics and indicators through dashboards: an advanced and flexible tool that allows for the personalized visualization of selected data and results. Neovero enables the configuration of different types of dashboards, taking into account the metric used and the information output model:
- Monitoring Dashboards: Provide real-time tracking of various situations within a unit, such as stopped equipment or pending work orders.
- Reporting Dashboards: Provide lists of items delimited by time that serve to inform data sets, such as inactive and/or pending equipment, by period and cause.
- Indicator Dashboards: Facilitate the visualization of all maintenance indicators, providing results useful not only for analyzing past periods but also for projecting trends and predicting future states.
Based on these models, periodic monitoring of dashboards supports quick and accurate decision-making in three key blocks of strategic management:
Efficiency and Productivity Management
Examples of metrics and indicators for productivity control include:
- Number of services performed per period, both internal and external.
- Productivity of technical workshops and outsourced services.
- Tracking of phases and pending services.
- SLAs (Service Level Agreements)
- MTBF (Mean Time Between Failures)
- MTTR (Mean Time to Repair)
Productivity dashboards, such as the SLA to measure Mean Time to Attend, are crucial for all aspects of service delivery, as they monitor response capacity and meet objectives according to agreements with sectors or clients.
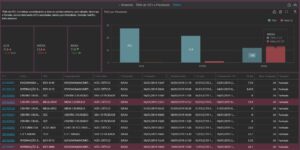
Figure 1 – Neovero System Dashboard: Mean Time to Attend
Regarding the control of workshop and technical staff productivity, the dashboard allows for visualizing the service order compliance rate by these staff, as well as the hours dedicated to different types of maintenance and/or families of biomedical equipment.
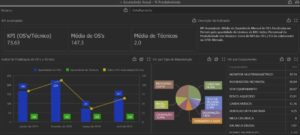
Figure 2 – Neovero System Dashboard: Technical Productivity
Productivity by Workshops can also be visualized through the percentage of completed work orders for each workshop. This example identifies completed service orders as well as open and pending orders for each registered workshop.
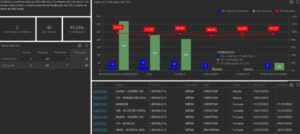
Figure 3 – Neovero System Dashboard: Workshop Productivity
Indicators like MTTR and MTBF are fundamental in managing hospital technological assets as they directly impact equipment availability. The following MTBF dashboard helps identify chronic failures and even predict new ones.
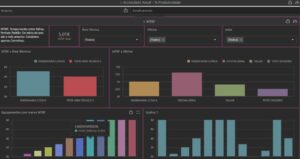
Figure 4 – Neovero System Dashboard: MTBF
The MTTR dashboard displays data on repair times, serving as an index of technical staff efficiency.
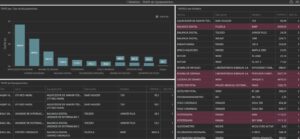
Figure 5 – Neovero System Dashboard: MTTR
Cost Management
For financial control related to maintenance, whether internal or external, the most commonly used cost metrics and indicators are:
- Cost of materials, parts, and replacements.
- Direct costs of executed services.
- Contracts and outsourced services.
- Maintenance cost vs. replacement cost.
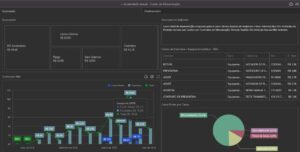
Figure 6 – Neovero System Dashboard: Maintenance Cost
The general maintenance cost control panel shows accumulated values over a specified period, allowing for easy identification of direct costs with parts, suppliers, and contracts in detail.
Quality Management
To manage the quality of services provided and asset availability, using dashboards like the ones presented below is key to maintaining patient safety standards during medical services.
- Analysis of causes and adverse events.
- Availability.
- Control of technical qualifications of workshops and their members.
- Qualitative assessment of internal and external services.
The Customer Satisfaction dashboard for service quality control measures the evaluation given by internal clients regarding requested and provided services. From the obtained data, it is possible to trace information such as the technical responsible for service execution, evaluation reason, and the result obtained.
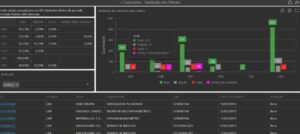
Figure 7 – Neovero System Dashboard: Customer Satisfaction
Additionally, the Equipment Availability dashboard controls asset performance over a specified period, with information on operation, downtime, and reasons for unavailability. Ensuring the safety and reliability of biomedical assets is crucial as it is intrinsically linked to patient treatment and diagnosis.
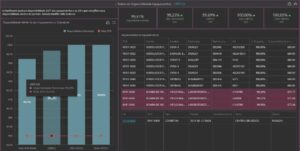
Figure 8 – Neovero System Dashboard: Equipment Availability
Models, Configurations, and Data Extraction
Depending on the visualization format, Neovero provides different types of customizable dashboards, including time series and quantitative variables, through line charts, bar charts, candlestick charts, or scatter plots, allowing for quick and easy analysis of states, trends, and developments.
Users can also customize output data and resulting graphs by applying filters to time series and qualitative variables as needed, focusing the analysis on periods or classes of interest. All metrics are available for download in .xls, .doc, or .pdf formats.
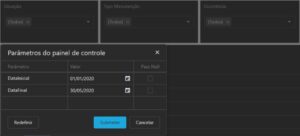
Figure 9 – Example of Applying Filters in Neovero System
As demonstrated throughout the article, Neovero facilitates, through our Dashboard tool, the processing of data and visualization of key metrics and indicators to efficiently and simply manage biomedical asset technology and healthcare institution infrastructure.


sales@logicbus.com | support@logicbus.com | +1 619 616 7350 | Start conversation