 Many electronic devices draw low levels of current when idle, then consume orders of magnitude more when active and transmitting. This application example looks at the current drawn by an Amazon Echo smart speaker but the techniques used apply to virtually any mobile, battery powered or IoT device.
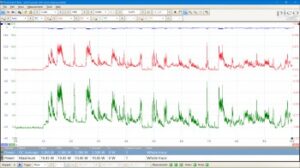
The high resolution, fast sampling and differential inputs make the PicoScope 4444 ideal for power measurement. Blue trace is supply voltage, red is current and green is power.
Current shunt measurements.
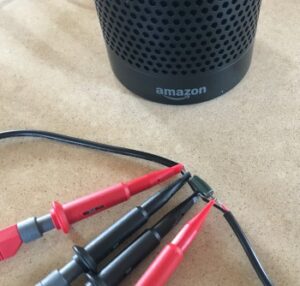 Measuring the fast-changing current drawn by modern electronic devices in different operating modes can be a significant challenge. Often devices draw microamps when inactive but then can quickly change modes drawing milliamps or even amps when active. The low level and wide range of standby current usually rule out the use of DC current clamps, so the normal method used is to record the voltage drop across a small shunt resistor. The resistor value should be chosen so that, at the maximum current draw, the voltage drop across it is small enough not to affect the operation of the device under test but large enough to suit the measurement device.
Current shunt (resistor) used to measure current drawn by Amazon Echo.
In this example the Amazon Echo is powered by a 15 V supply rated at 1.5 A. A good rule of thumb is to choose a resistor value that will cause a voltage drop of no more than 1% at maximum current. In this example we inserted a 0.11 Ω resistor in the power cable to the Echo. This gives a 165 mV drop at 1.5 A, which should have no impact on the operation of the device and not dissipate enough power to have concerns about self-heating of the resistor. We could have used a smaller resistor but, where possible, it is better to use one of the measurement device’s less sensitive ranges to reduce noise pickup.
As can be seen from the photo, we also measured the supply voltage to allow us to calculate power. It is important to measure the voltage on the device side of the resistor to exclude the power dissipated by the shunt resistor.
Scaling and resolution.
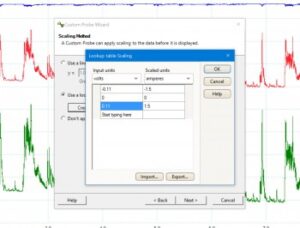 You can use PicoScope’s custom probes feature to scale the voltage dropped across the resistor into amps. A simple maths channel (V x I) allows you to add a display of power in watts.
It is worth considering the effect of the oscilloscope’s resolution on the measurement. The biggest signal we can measure is set at 1.5 A, which corresponds to +165 mV. The best input range for measuring this is the ±200 mV range (effectively a ±1.82 A range).
With the PicoScope set to the 14-bit resolution (16 384 vertical steps) this gives a current measurement resolution of 0.22 mA, which is sufficient for this application.
Hint: in this case we measured the 165 mV maximum input using a ±200 mV full-scale range. This wastes more than half the resolution of the oscilloscope as the input signal only goes from 0 mV to 165 mV. It would have been better to use a ±100 mV range and then use the analog offset feature to create a unipolar 0 to 200 mV range. This would have improved the current resolution to 0.11 mA (roughly equivalent to a 4.5 digit meter).
If you need more resolution, you can enable resolution enhancement at the expense of a reduced sampling rate. Of course, if making measurements in a specific mode where the full 1.5 A will not be drawn, you can set the oscilloscope to a lower full-scale range all the way down to ±10 mV, giving microamp resolution.
Differential measurement and fast sampling.
The placement of the current shunt resistor depends on whether you wish to measure the power drawn by the whole device, or one part of it such as the processor or Wi-Fi module. Often a device under test has several measurement points. The differential inputs of the PicoScope 4444 used in this application are ideal, as each channel can be connected across a different resistor (whether high-side in the supply or low-side in the ground return) without any of the concerns about short circuits or ground loops that occur when using a traditional benchtop oscilloscope.
The current drawn by components such as microcontrollers and memories can change in microseconds. To capture these fast changes requires a measurement instrument that has enough bandwidth and sampling rate. The PicoScope 4444, with its 20 MHz bandwidth and 400 MS/s maximum sampling rate, is ideal for measuring fast-changing currents.
Hint: when trying to measure the fast-changing current drawn by a processor, memory or Wi-Fi module it can be useful to temporarily remove or reduce the decoupling capacitors in order to see the peak current drawn and its rise time.
Amazon Echo power supply.
Before measuring the Echo’s power consumption in different modes, we had a quick look at the output from the switching mains power supply without the Echo connected. We used Channel A to measure the voltage with DC coupling (15.36 V). Channel B measured the same signal with AC coupling on a more sensitive range, showing around 150 mV of noise with a 86 Hz frequency.
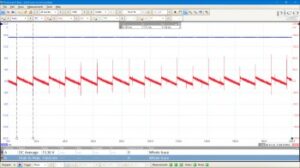 With the Echo connected, the DC voltage and ripple voltages were similar (15.36 V and 135.5 mV) but the ripple frequency increased from 86 Hz to 19.64 kHz, revealing that the PSU skips pulses at no load to improve efficiency.
DC voltage and ripple from the mains power adaptor.
Playing loud music.
With the Echo set to play music at the maximum volume, we measured the supply voltage, current and power. The maximum current drawn was only 771 mA, suggesting that the 1.5 A power supply is more than sufficient for the device. At peak current the 15 V supply dipped by 216 mV (1.4 %). We added automatic measurements for average power (3.383 W) and peak power (11.58 W).
 The high resolution, fast sampling and differential inputs make the PicoScope 4444 ideal for power measurement. Blue trace is supply voltage, red is current and green is power.
Standby power.
As the Amazon Echo is designed to be left switched on waiting for a command, it is important to know how much power it uses in this idle state. To measure this, we left the Echo in standby mode and then woke it up and asked it to play music at a low setting (volume 3).
The green trace shows the current waveform at full bandwidth, with switching noise making it difficult to observe the signal. The red trace has a 10 Hz software filter applied in PicoScope to clean up the trace.
The first 11.6 seconds show the Echo in standby, when it is drawing 114 mA (1.71 W).
Over a year, assuming a typical 85% PSU efficiency, the Echo would use about 18 kWh. This adds around £2.20 (about $2.70 or €2.50) to your electricity bill at the average domestic price per kWh in the UK of £0.126.
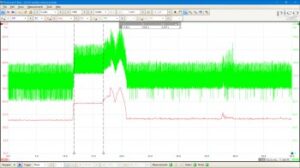 The area between the rulers shows the power jump when the Echo detects a command and transmits across Wi-Fi. Surprisingly, when playing music at a low setting the current drawn is nearly the same as at standby (117 mA vs 114 mA), so it will make little difference to your electricity bill whether the Echo is in standby or playing music quietly in the background.
Standby power – approx 15 kWh (plus PSU losses) per year.
Contact us


sales@logicbus.com | support@logicbus.com | 55-5431-6718 | Start conversation

