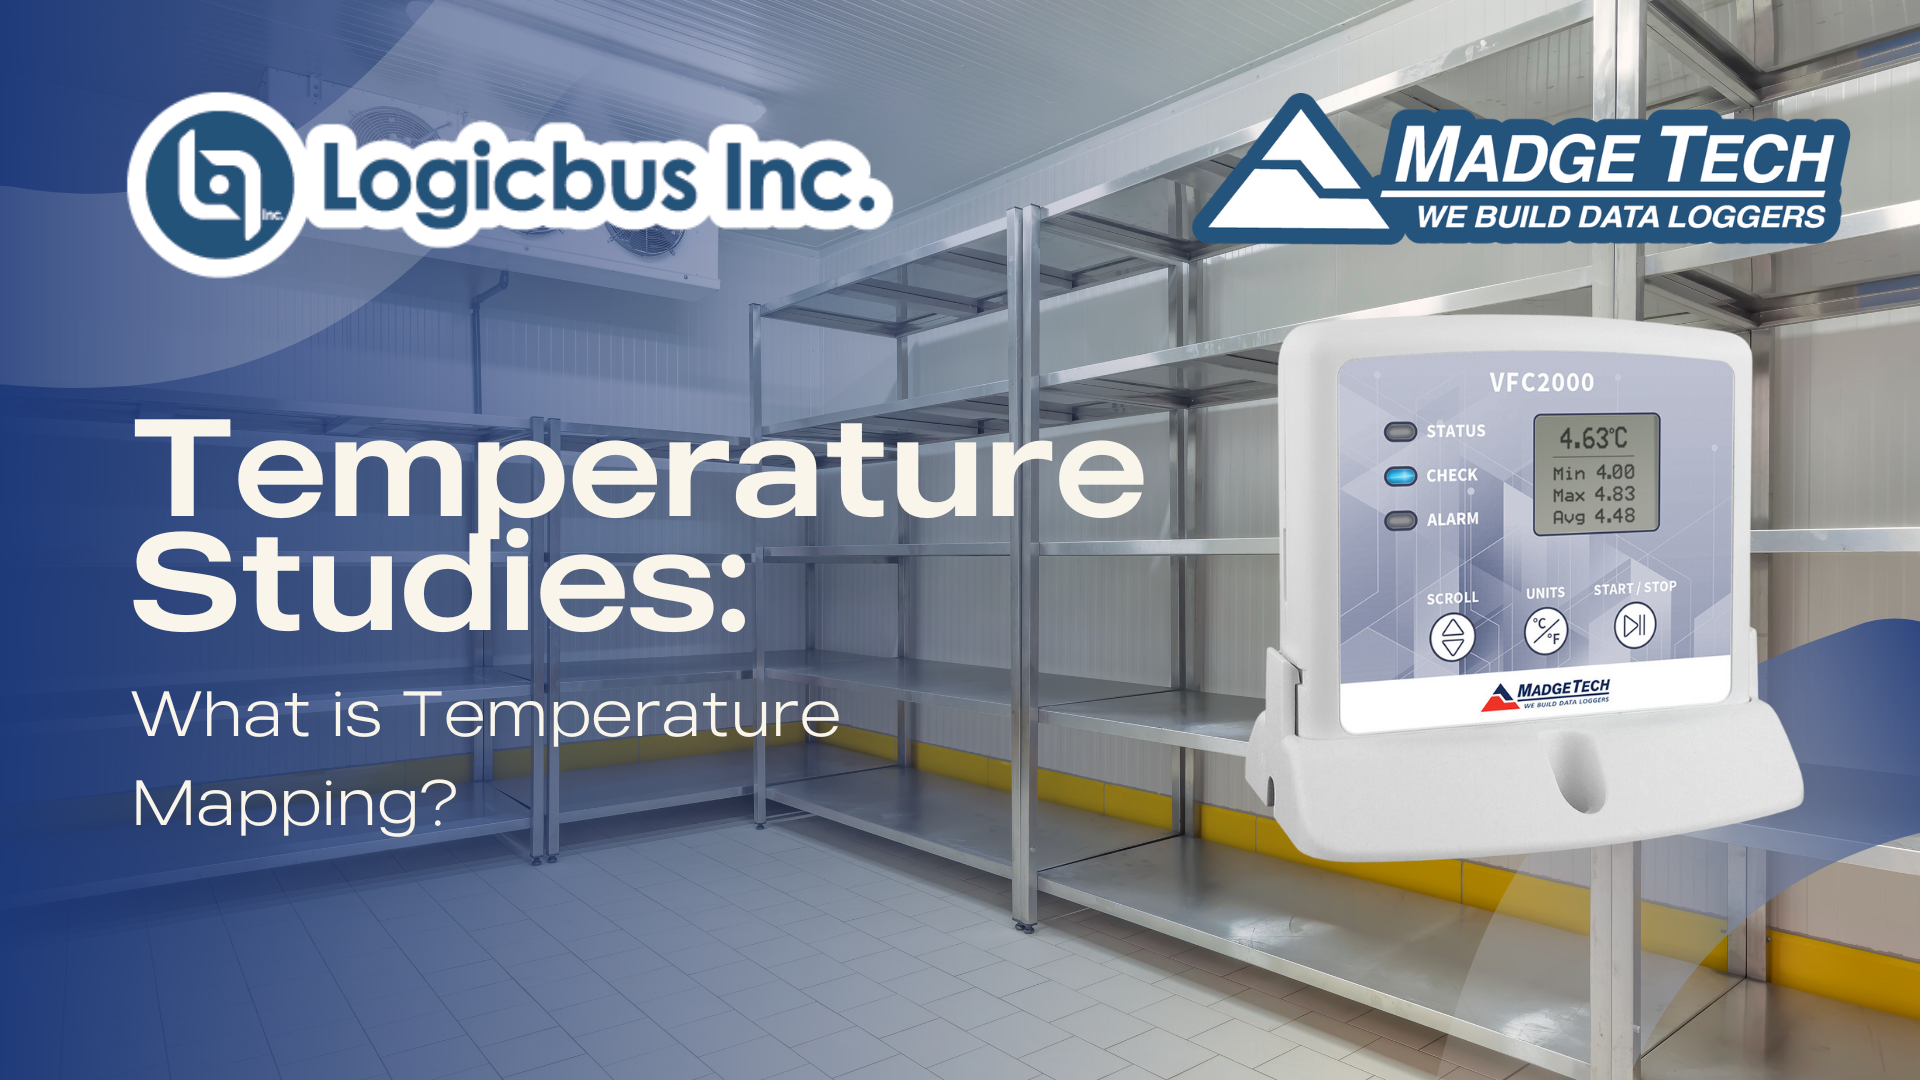
What is temperature mapping and why is it important?
Temperature mapping, also known as thermal mapping, is the process of acquiring a temperature profile within a controlled area (for example, a refrigerator, freezer, vehicle, or warehouse) to better manage the product being stored. The data collected can help to identify hot and cold spots as well as temperature fluctuations that could be caused by events such as opening and closing doors, airflow problems, or heat generated by equipment. Over time, these fluctuations and temperature variations can affect the overall efficacy and quality of the product which can have disastrous, and even deadly, results.
Who needs to do temperature mapping?
In the United States, the Federal Drug Administration (FDA) publish standards (known as GxP) that outline practices to ensure products are safe for consumers. One part of these standards states that a mapping study must be performed for any space where medicines, vaccines, biological samples, or temperature-sensitive products are stored. Depending on the industry, additional regulations may be in place for temperature mapping of medical, pharmaceutical, biotechnology, and food products.
How is a temperature mapping study conducted?
A temperature mapping study is conducted by strategically installing multiple temperature data loggers throughout a specified area to continuously record conditions over a set period of time.
The FDA and GxP offer general guidelines but do not say how exactly to conduct the study. The company determines the actual plan, based on what the space is used for and what mapping is looking to show
Once the logging is complete, the devices are collected and data is downloaded. The analysis phase is next, and this is when the true results of the study can be seen. As with before, any findings (such as hot or cold spots) should be documented. Data can be compiled into one main report or into separate reports for individual analysis of time and temperature excursions.
Get to know the Madgetech products ideal for temperature mapping
Visit our website:
www.logicbus.com


sales@logicbus.com | support@logicbus.com | +1 619 616 7350 | Start conversation

