

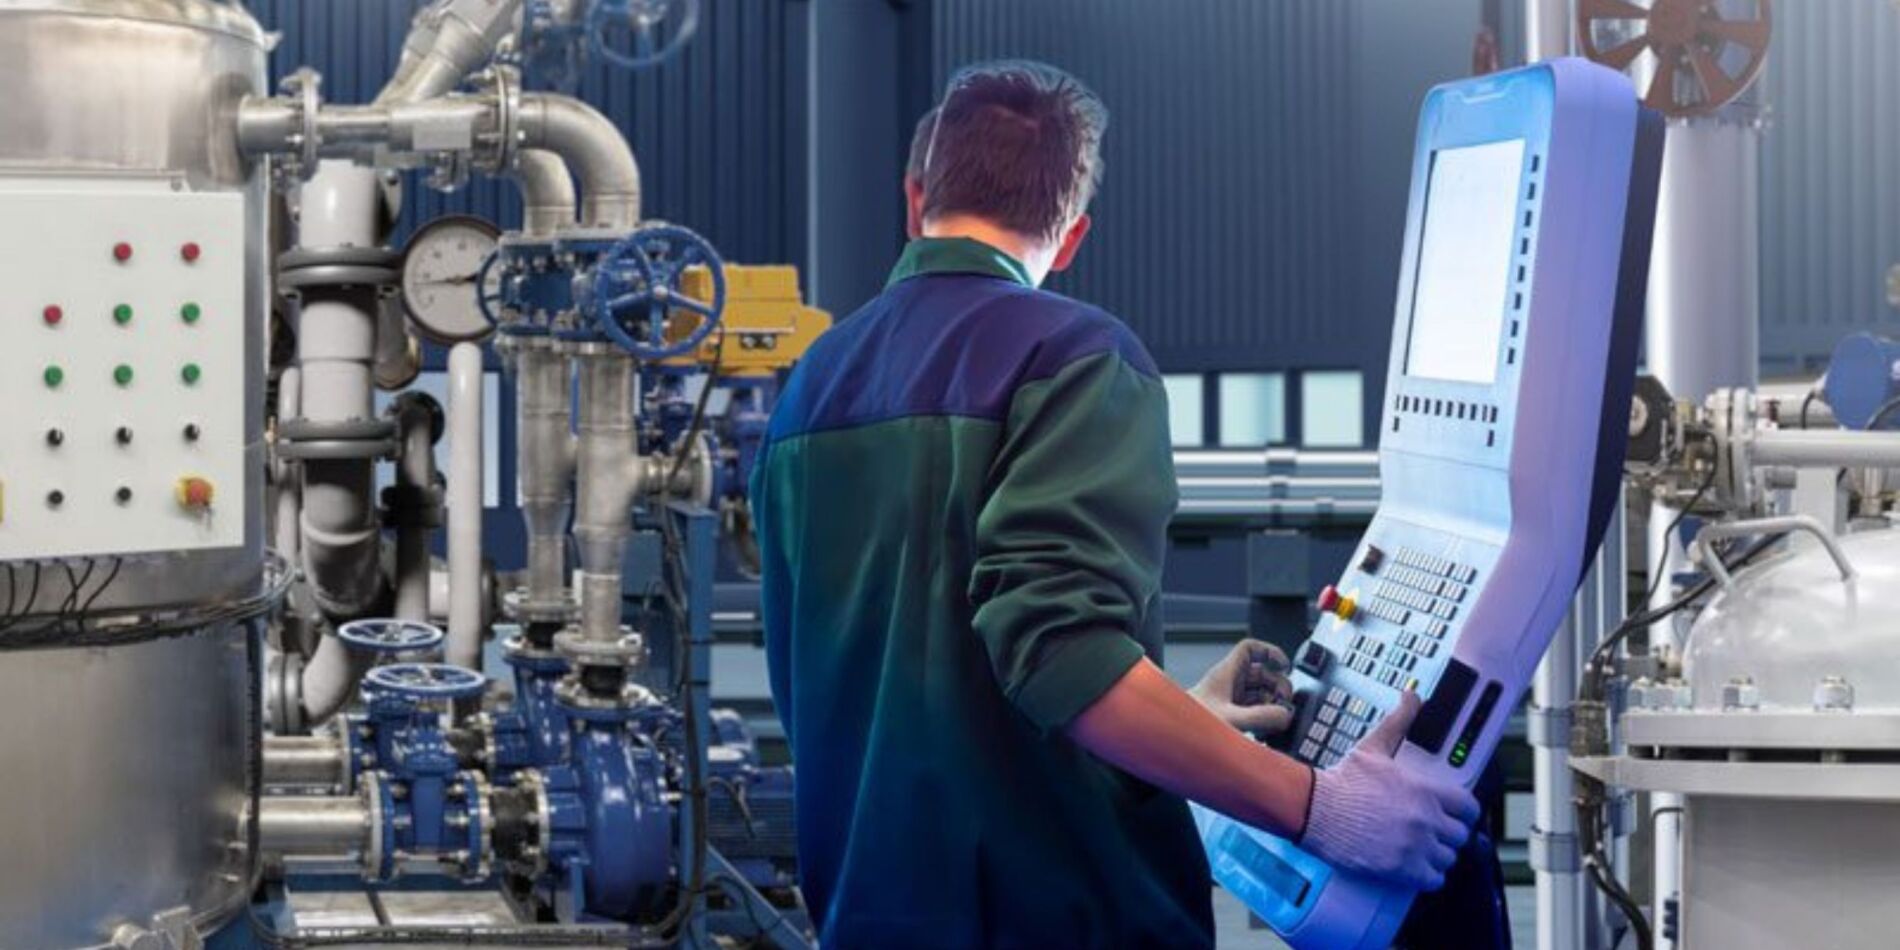
Intermittent machine failures—where a converting line randomly rejects 200 units or halts without throwing a fault code—create severe diagnostic blind spots. Without an exact snapshot of the machine state at the millisecond of failure, maintenance teams are forced to guess whether the root cause is a logic bug, a sensor misread, or a mechanical bind. Resolving these ghost faults requires capturing high-frequency time-series data leading directly up to the event.
The Architecture of Machine Diagnostics 
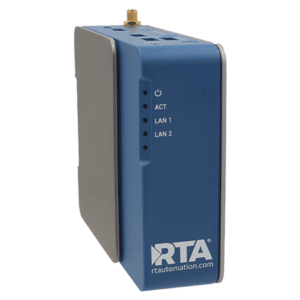
A data historian acts as the flight data recorder for the PLC, continuously logging process variables, I/O states, and system flags. While enterprise-level historians operate on virtual machines or cloud servers to aggregate plant-wide data, cell-level historians are deployed directly at the machine edge. Cell-level units provide the localized, high-speed data ingestion required to trap intermittent logic conditions without burdening the primary plant network.
Clock Synchronization and Fault Reconstruction
Accurate fault reconstruction relies on precise time synchronization across the control architecture. Industrial historians utilize Real-Time Clocks (RTC), Network Time Protocol (NTP), or Precision Time Protocol (PTP) to align data points across multiple PLCs and drives. When a machine halts unexpectedly, the time-series data sequence immediately preceding the stop reveals the exact trigger condition.
Raw Data Export and Middleware Bypass
To be effective, diagnostic data must be immediately accessible. Modern edge historians bypass proprietary middleware, publishing directly to SQL databases via HTTP, WebSockets, or MQTT. For offline troubleshooting, they allow engineers to export CSV files directly via FTP or USB for rapid analysis in Excel or integration with visualization platforms like InfluxDB.
Industrial Application Cases
-
Converting & Packaging Lines: Tracking product registration anomalies where high-speed positioning systems drift intermittently, causing localized scrap runs of consumer paper products before the servo loops self-correct.
-
Automated Assembly Cells: Capturing the exact I/O state when a complex automation cell executes an uncommanded stop, isolating the specific proximity sensor, safety relay, or logic block responsible for the interruption.
-
Material Handling: Monitoring variable frequency drive (VFD) torque feedback and PLC speed commands to identify intermittent mechanical binding or material jams in long conveyor networks.
Historian Architecture Comparison
Specification / Feature Cell-Level Historian (Edge) Enterprise Historian (Server/Cloud) Primary Engineering Focus High-speed machine diagnostics & troubleshooting Plant-wide aggregation & historical trending Deployment Location On-machine, control cabinet (DIN rail) Server room, Virtual Machine (VM), or Cloud Data Ingestion Direct from local Allen-Bradley or Modbus PLCs Aggregated from multiple plant gateways Storage Capacity Up to 1 TB localized solid-state storage Petabytes (Hardware/Cloud dependent) Network Bandwidth Impact Low (localized polling and storage) High (requires heavy IT infrastructure) Software Overhead Standalone, no subscription/licensing constraints Heavy middleware, recurring licensing fees Deploying the right diagnostic architecture eliminates the guesswork of intermittent faults. Logicbus supplies rugged, cell-level data historians capable of logging multi-protocol PLC variables with massive local storage, requiring no continuous licensing fees or complex middleware integration. To specify a data collection device to monitor your exact machine architecture, contact our North American application engineering team at www.logicbus.com.




sales@logicbus.com | support@logicbus.com | +1 619 616 7350 | Start conversation